Boston Building Violations Study
My Thoughts
This semester, my teammates—John Salloum, Chloe Lesson, Michael Tran, Farzaan Naeem—and I had the incredible opportunity to work with the Citywide Analytics Team, the central data organization of the City of Boston. Our project aimed to uncover systemic issues in housing through comprehensive data analysis, providing insights that could lead to strategic and structural remedies.
Key Objectives:
- Identify Patterns: We analyzed housing violation data to identify repeat offenders among landlords and management companies, utilizing
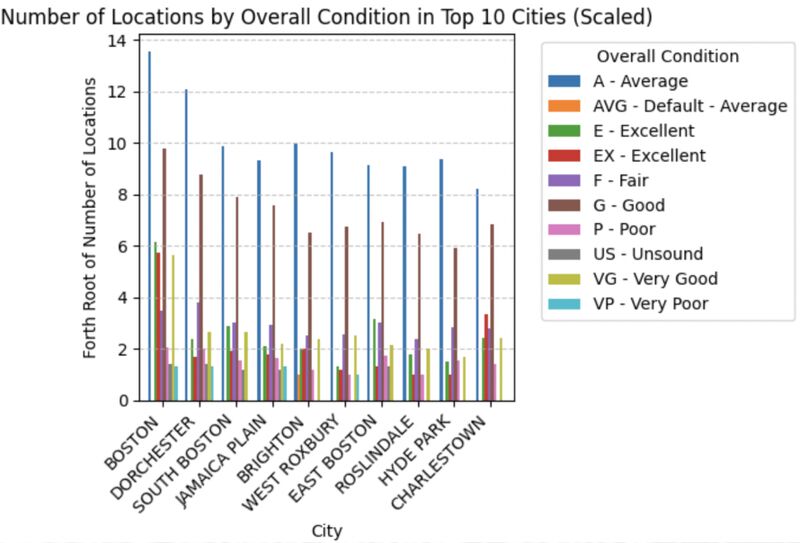
pandasandnumpyfor data manipulation. - Examine Building Features: We looked into common characteristics of buildings that frequently face violations, focusing on construction and remodel years. Statistical analyses were visualized using
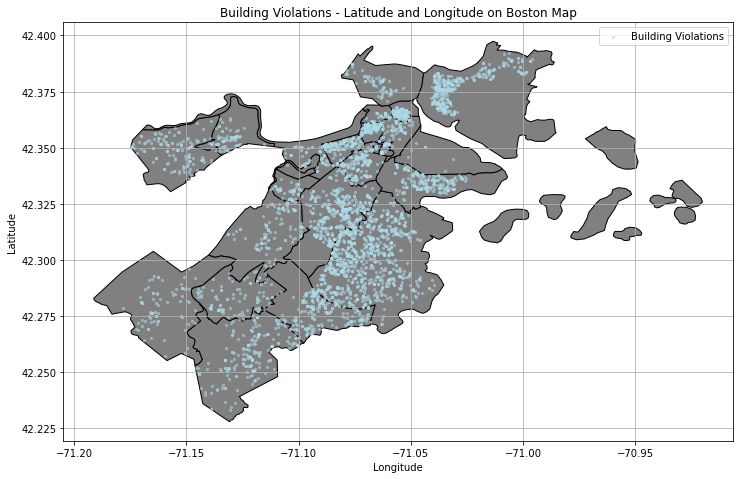
matplotlibandseabornto highlight trends. - Community Impact: We mapped out the most affected neighborhoods and communities, leveraging geospatial data with
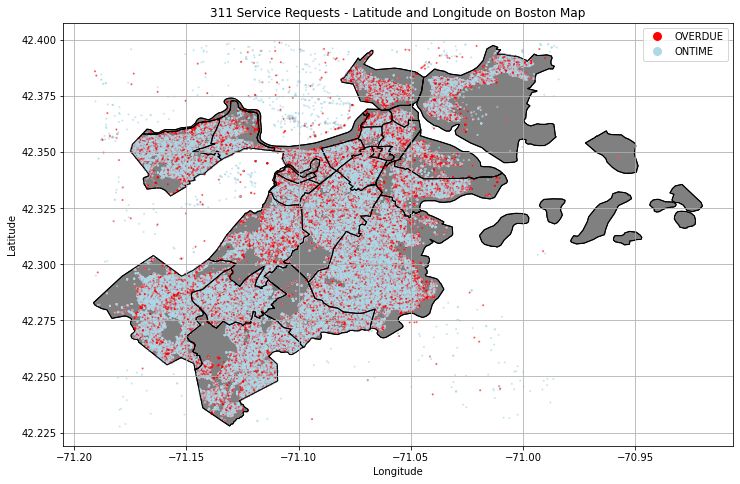
geopandasandshapely.geometryto visualize the distribution of complaints. - Complaint Types: Using 311 service request data from 2019 to the present, we categorized and analyzed the most common types of building complaints. Advanced data aggregation techniques, including time-series analysis and multi-source data integration, were employed to provide a clear overview of the types of complaints and their causes.
Extension Project:
Building on our findings, we initiated a deeper dive into the demographics of the most affected neighborhoods. We examined whether certain communities are disproportionately marginalized, using data from the 2020 Census. This involved normalizing violation data by the number of occupied buildings and comparing it with demographic trends to spot any correlations. Our analysis included k-means clustering to discern patterns in demographic data, providing a nuanced understanding of community impacts.
Challenges & Solutions:
A major challenge was aligning the neighborhood data from various datasets. We overcame this by using zip codes to reclassify the data accurately, thereby rectifying potential overlaps in neighborhood boundaries.
Outcomes:
Our final deliverable was a detailed report and presentation that included a set of dynamic visualizations. Our insights highlighted critical trends in housing violations and demographic disparities, which provided actionable insights designed to help city officials prioritize initiatives in the most impacted neighborhoods—focusing on repeat offender landlords and targeted community support where it is most needed.
Thank you to Hope R. and Tom Hopper for giving our team the opportunity to share our insights with you! We are grateful for the chance to contribute to the City of Boston's initiatives and look forward to seeing how our work can improve the quality of living conditions in Boston.